Show results in colour, with a legend
Model View colours the model by a result, in the unit you pick, and can write the values on it. Legend draws the colour scale beside it. Use them to read a result on the model it belongs to, or to make a figure for a report.
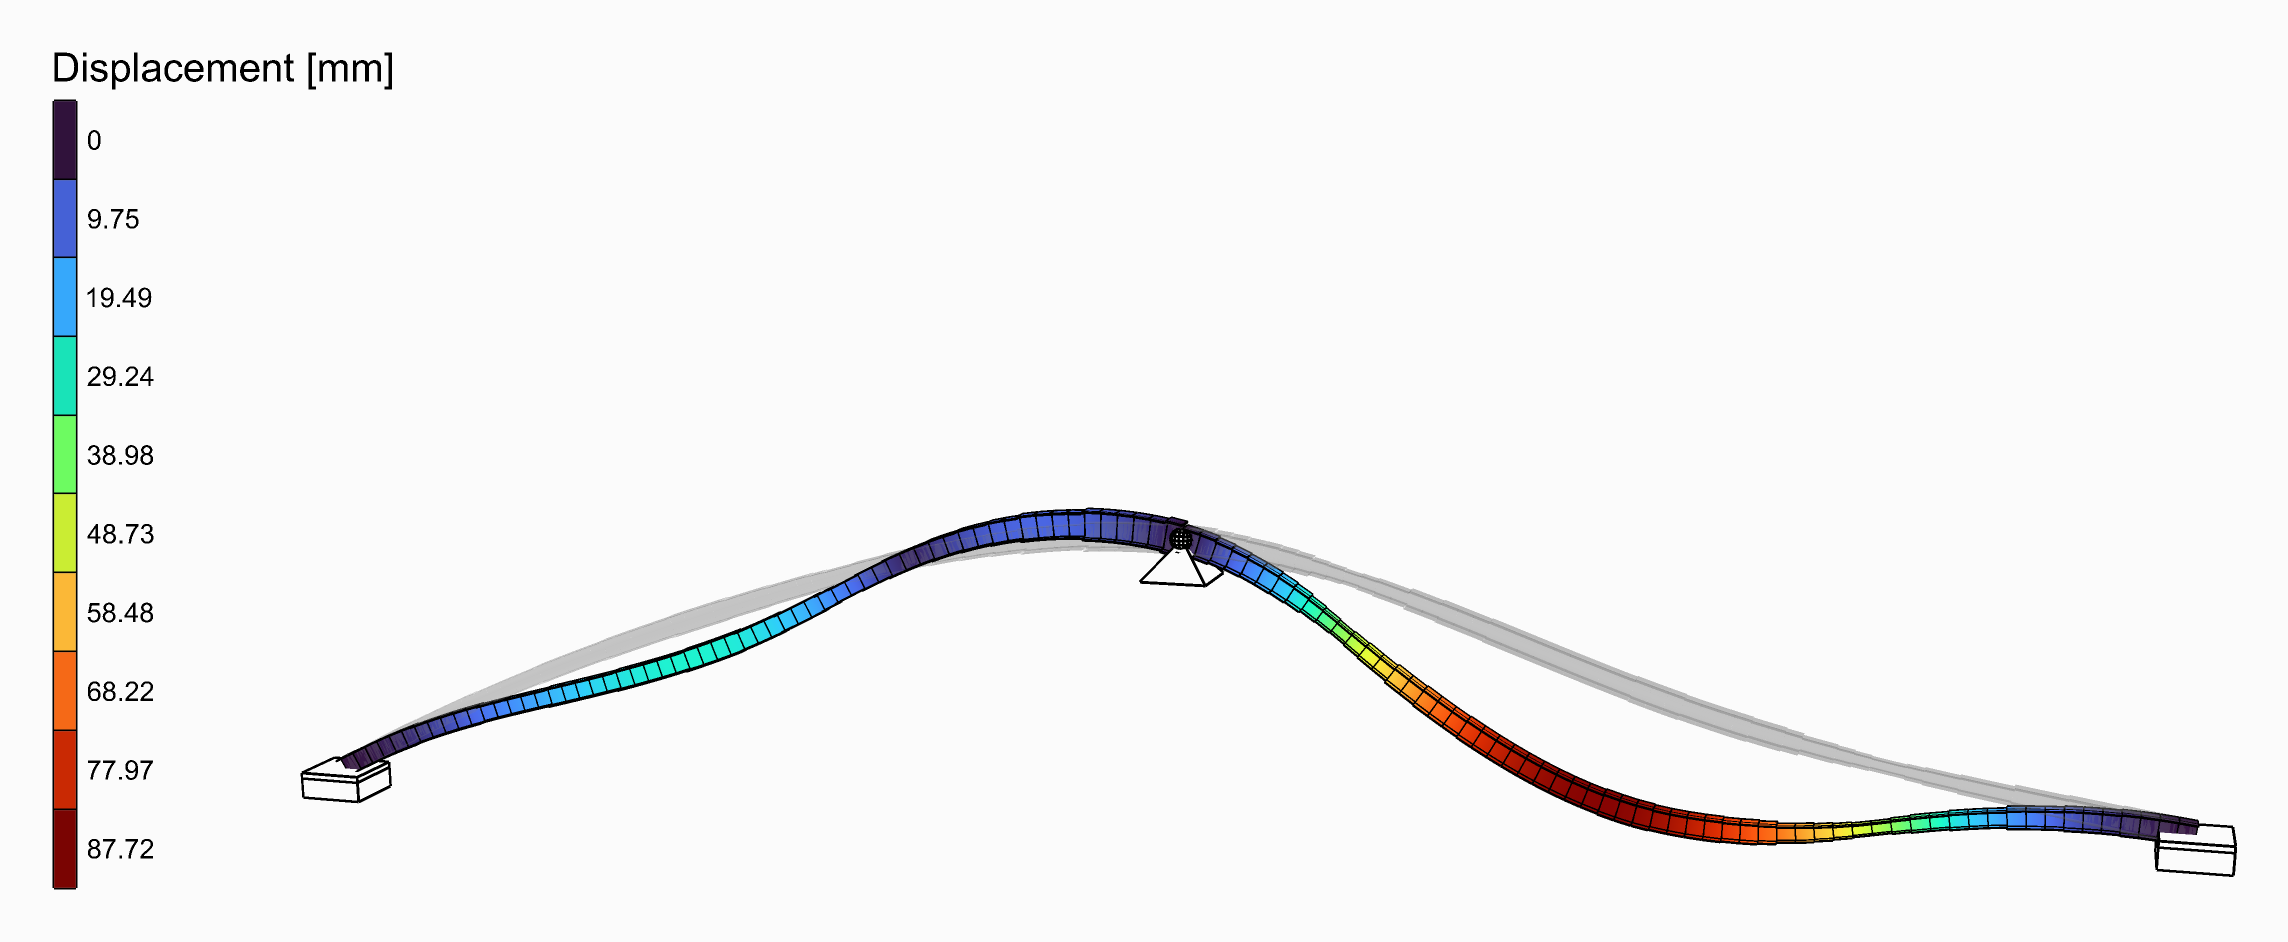
The deformed shape, coloured by displacement, with its Legend.
You need
- A model analysed by Run Analysis, Natural Vibration or Linear Buckling.
- Model View and Legend, from Alpaca4d ▸ 09_Visualisation, and Colors for a gradient other than Turbo.
Steps
- Wire the analysed model into the AlpacaModel input of Model View. Step picks the recorded step,
0the first. - In the Results menu, tick the result to draw, such as Displacement. Under it, pick its Component, such as
Uz, and its Unit, such asmm. Tick Deformed shape to draw it on the deformed model. - Wire the Values output of Model View into the Values input of Legend, and Colors into Colors. Type the quantity and its unit into Title:
Uz [mm]. - For another gradient, wire Colors into the Colors input of Model View and set its GradientIndex:
1, Viridis, for a quantity running from nothing to a maximum,7, Coolwarm, for one that changes sign. The legend follows through the wires of step 3. - To write the values on the model, tick Show values in the Results menu. Text size, in the Elements menu, sets their height.
- To compare two steps or two designs, give Range an interval, in the unit picked. The colours then stand for the same values in both.
Check
Info has a line per result, with its unit and the range it spans: Displacement - Uz [mm], step 0, min -12.3, max 0. With no Range, the legend runs from that min to that max.
Good to know
- Tick several results and they are drawn together. Values and Colors then have a branch per result, and one Legend draws a legend for each, side by side. Give Title a title per result, in the order of the Results menu.
- Beam forces has no gradient: its diagrams have colours of their own, it ignores Colors, and it has no branch in Values and no interval in Range.
- Iso-surfaces colours in bands, one per colour. The legend then writes the band edges between its swatches.
- Legend does not read Model View. Fed from anywhere else, give it the same Colors, and the two ends of the Range as its Values.
See also
- Model View — every result, its components and units
- Legend — position, scale and several legends
- Colors — the eighteen gradients, and which to choose