Moment Curvature Diagram
Draws the curves of one or more Moment Curvature analyses in the Rhino viewport, with labelled axes: κ across, M up, each curve's first yield in orange and its ultimate state in red. Wire several results to compare them, at different axial forces or in different directions.
🔧 Grasshopper component
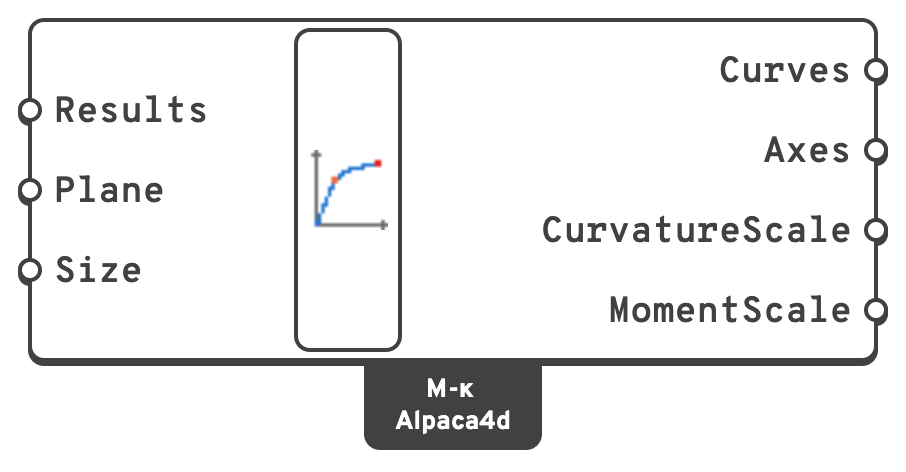
Moment Curvature Diagram (Alpaca4d) — Alpaca4d ▸ MomentCurvature_βeta, nickname M-κ
Inputs
ResultsThe Result output of one or more Moment Curvature components.
PlaneWhere the origin, no curvature and no moment, is drawn, and which way the axes go.
Left empty, the world XY plane.
SizeHow large the diagram is drawn, in model units: the largest curvature and the largest moment both fit in it.
Outputs
CurvesEach result's curve, from the origin.
AxesThe κ and M axes.
CurvatureScaleModel units per
rad/m.MomentScaleModel units per
kN·m.The curves and axes go out as geometry and bake; the labels and the points are drawn on screen. With several results, each curve is named by its axial force and direction at its end.