Legend
Draws a fixed on-screen colour scale — the key that makes a contour readable.
🔧 Grasshopper component
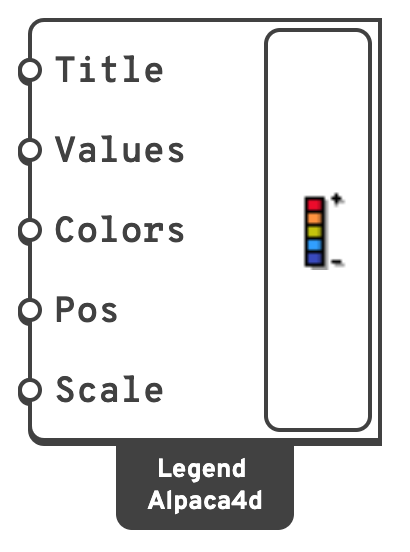
TitleHeading above the scale.
mxx [kN·m/m]. With a branch of Values per legend, a title per legend, in the order of the branches.ValuesNumbers the labels run from the smallest to the largest of — the Values output of Model View.
0 left, 1 right, 2 bottom centre.ScaleSize multiplier. Values at or below zero fall back to 1.5.
None. The component draws straight to the viewport.
📈 When to use it
Use it when
- Any time you show a contour from Model View. A contour without a scale says nothing.
- You are producing a figure for a report.
💡 Getting it to agree with the contour
The legend does not read Model View — it reads whatever you give it. Wire the Values and Colors outputs of Model View into the inputs of the same names, and the two stay in step: Values holds the value each colour stands for, over the Range you gave Model View when you gave one.
With Iso-surfaces on in Model View, Values holds the edges of its bands — one value more than there are colours — and the legend writes them on the lines between its swatches, so each swatch reads as the band from the label above it to the label below.
With several results ticked in Model View, Values and Colors hold a branch per result, and one Legend draws a legend for each, side by side — inwards from the edge at the left or the right, upwards from the bottom. Give Title a list of titles, one per result in the order of Model View's Results menu: Uz [mm], then Von Mises [MPa]. A Legend of its own per result, fed one branch through Explode Tree, can go at another Position.
If the numbers come from somewhere else, such as a Results component, give the legend the same Colors as the contour, and if you fixed a Range there, give its two ends as Values.
The legend is drawn in screen space, so it stays put and stays the same size as you orbit and zoom.