The Explorer example: a steel footbridge analysed with Alpaca4d, and a design study of it. Two Warren trusses side by side, joined by cross beams at every node, pinned at one end and free to slide along the span at the other, carry their own weight and a deck load.
The study steps through four inputs:
| Input | Values |
|---|---|
| Span | 20, 25, 30, 35 m |
| Depth | 1.5, 2.25, 3 m |
| Panels | 6, 8, 10 |
| Chord | HEA 160, HEA 200, HEA 240 |
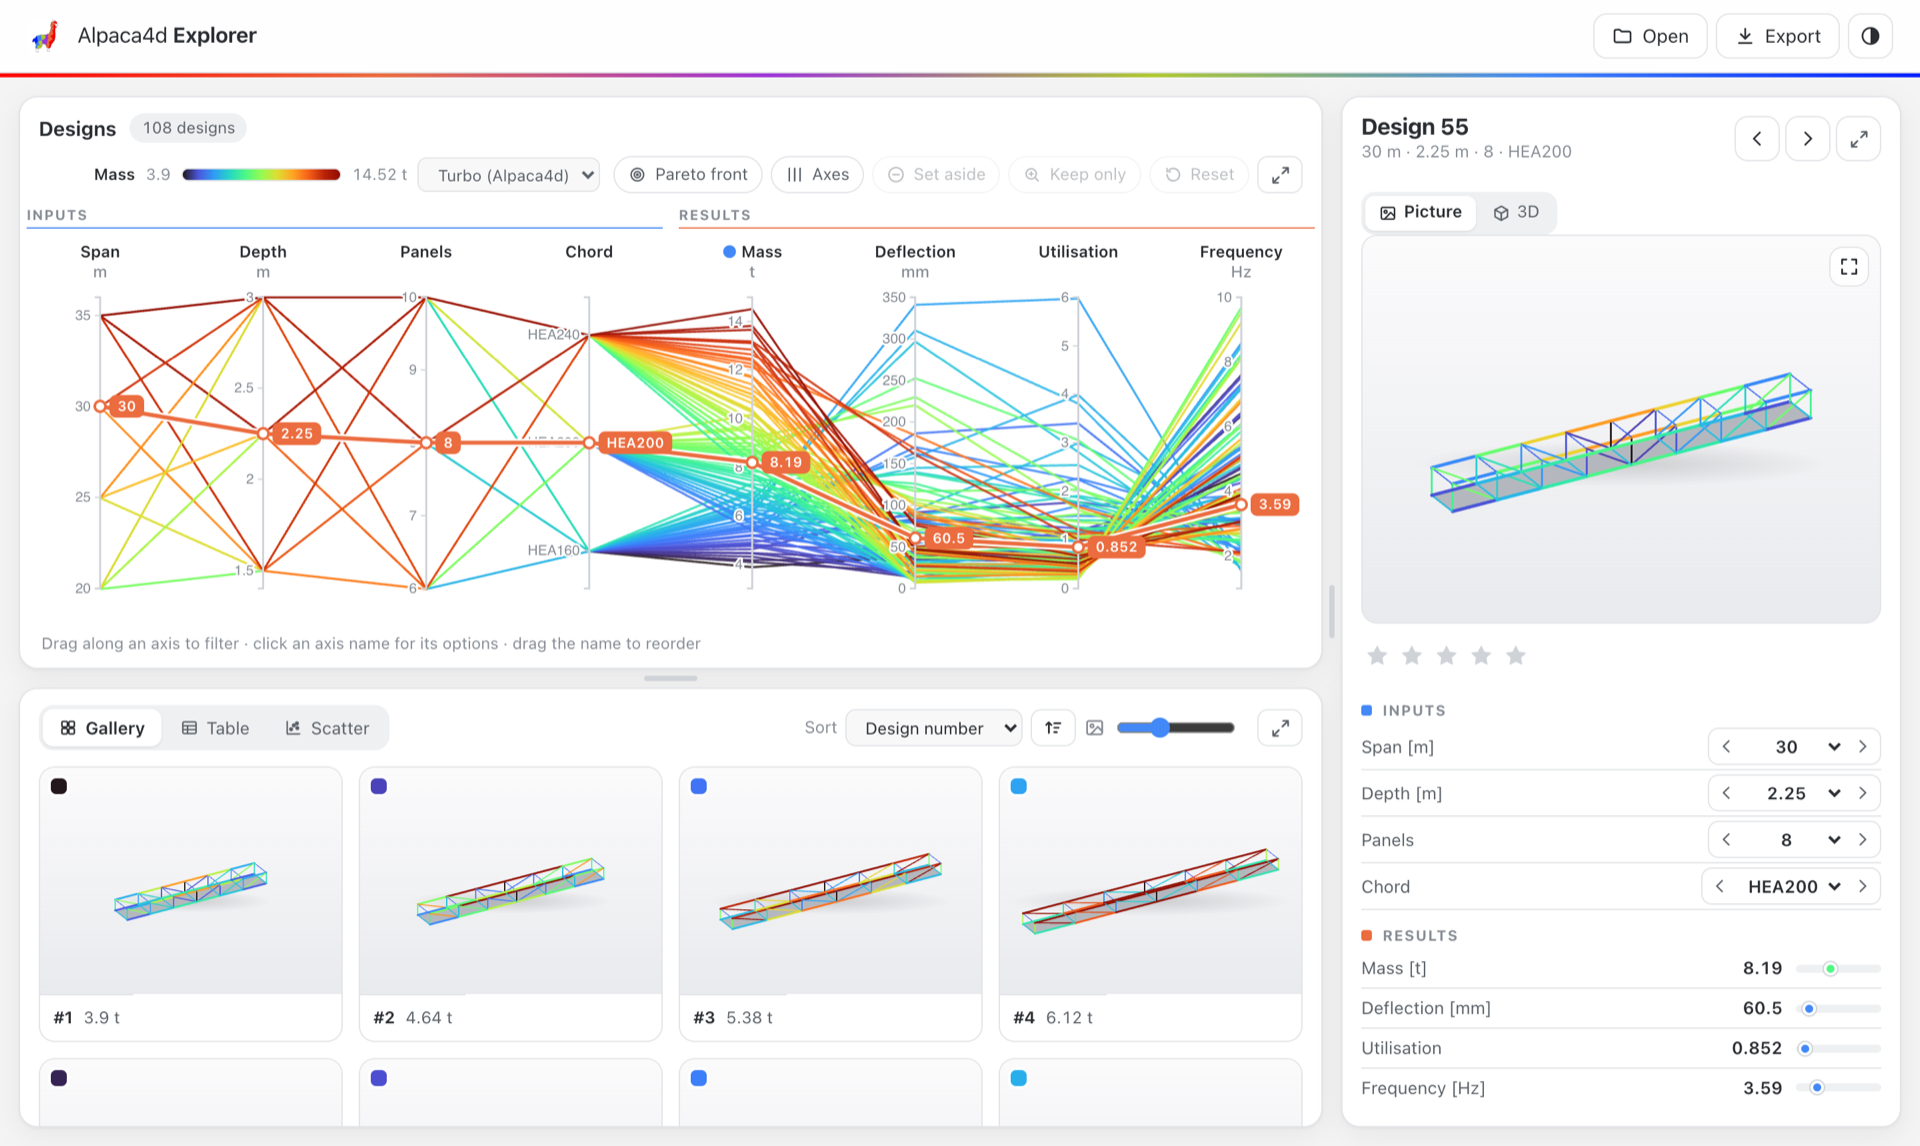
108 designs. Each is analysed, checked to EN 1993-1-1 with Utilisation, solved for its first natural frequency, and recorded with its mass, largest deflection, highest utilisation and frequency, a picture and its 3D model.
Running the study
- Save the definition. The study is recorded next to it, in
AlpacaExplorer. - Show the bridge in a perspective view in Rhino: each design's picture is taken from the active viewport.
- Set Write, on Explorer Record, to true.
- Press Fly under Explorer Inputs. Right-click it ▸ Test fly runs three designs first, to check the pictures.
- Right-click Explorer Record ▸ Open the Alpaca4d Explorer, and drop the study folder on the page.
The groups on the canvas follow the data: the design inputs, the trusses drawn with Grasshopper's own components, the members, the bearings and loads, the analysis, the results, and what each design is saved with.
INFO
The picture above is the Alpaca4d Explorer open on its sample study: the same bridge, with results estimated by hand rather than analysed. Your own run records Alpaca4d's results in the same layout.